March 1, 2024
In the pursuit of maximizing agricultural productivity, especially within controlled environment agriculture (CEA), understanding and utilizing the phenomenon of light photosaturation is becoming increasingly significant. This article explores how it impacts crop yield, why it’s a focal point for growers, and how leveraging this knowledge can revolutionize agricultural practices in controlled environments.
What is Light Photosaturation?
At its core, light photosaturation refers to the point at which plants receive the maximum amount of light they can use for photosynthesis. Beyond this threshold, additional light does not translate to increased photosynthesis rates, potentially leading to wasted energy or even light stress. In CEA, where lighting can be precisely controlled, understanding this threshold is crucial for optimizing plant growth and energy efficiency [1].
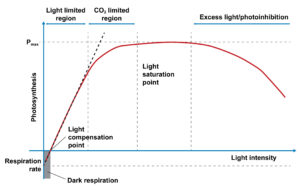
The figure below shows a light response curve which is a graphical representation of the relationship between light level and photosynthesis. The light response curve is sometimes referred to as a photosynthesis-irradiance (PI) curve.
As shown in the light response curve below, as light intensity increases from zero, it reaches a point where there is enough for a plant to grow. This is the light compensation point. It’s also where the energy generated from photosynthesis equals the energy the plant uses for plant maintenance [2].
As light intensity increases, so does the photosynthesis rate. This continues until the curve begins to flatten out, a point known as the light saturation point. After this point increasing light level does not significantly increase the photosynthetic rate. As light intensity continues to increase, there reaches a point where there is excess light and the photosynthetic rate actually decreases. This is known as photoinhibition.
All photosynthetic organisms follow this trend, yet the values for light compensation, photosaturation, and the slope of the photosynthetic rate varies among species.
Why the Interest?
There are several reasons growers should care about the light response curve and photosaturation:
- Maximizing Efficiency: In controlled environments, resources such as light and energy
are valuable. By identifying the light response curve parameters for their crop, growers can make decisions that optimize light usage, ensuring plants receive the exact amount needed for maximum growth without wastage. Since the curve is not linear, adding the same amount of supplemental light to lower light conditions has a bigger impact than at higher conditions. Depending on the overall productivity and cost-analysis, it may be beneficial to target these more efficient portions of the light response curve, especially when limited on power or capital equipment budget [2]. - Enhanced Crop Yield: Proper light management can lead to healthier plants and higher yields. By avoiding under or over-illumination, crop yield can be optimized. Finding the ideal operating level goes for not just light, but for parameters such as temperature, water supply, nutrient concentration, pH, humidity, etc. [3]
- Energy Reduction: Energy is a significant cost in CEA. Making sure to light plants below their light saturation point ensures it isn’t wasted.
Implications for Crop Yield:
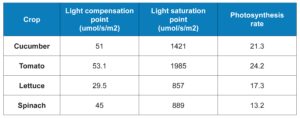
Research shows that crops exposed to optimal light levels corresponding to their photosaturation point exhibit better growth, higher nutritional quality, and increased yields. This is particularly relevant for high-value crops in CEA, where investment in precise lighting can lead to significant returns.
Below is a table showing example light compensation and saturation points. These are for reference only (please check recent literature for specific cultivars or strains). An important note is that light response curve can be influenced by CO2 concentration. As it decreases, so does the light response curve. For more information about this and for example results, please refer to the article “Photosynthetic Responses of Greenhouse Ornamentals to Interaction of Irradiance, Carbon Dioxide Concentration, and Temperature” by USDA-ARS [4].
How Growers Can Use This Knowledge:
There are several tasks growers can perform in order to take full advantage of plant light response curve and prevent wasting energy.
- Monitoring and Control Systems: Implementing advanced lighting systems with sensors to monitor light intensity and duration can help maintain optimal lighting conditions.
- Species-Specific Strategies: Different plants have varying photosaturation points. Tailoring light regimes to specific crop needs is essential.
- Experimentation and Adaptation: Regularly testing and adapting light levels based on plant response and environmental factors can refine growing strategies over time.
Knowing exactly how much light is needed by a plant helps them thrive without wasting energy. Our DLI Calculator can help you determine what that ideal amount of light is.
Conclusion:
Understanding and utilizing light photosaturation in controlled environment agriculture presents a frontier for enhancing crop productivity. By precisely managing light, growers can not only improve crop yields but also achieve sustainability through energy conservation. As technology advances, the potential for fine-tuned light management in CEA will undoubtedly grow, leading to more efficient and productive agricultural practices.
References:
[1] Lin M, Wang Z, He L, Xu K, Cheng D, Wang G. (2015) Plant Photosynthesis-Irradiance Curve Responses to Pollution Show Non-Competitive Inhibited Michaelis Kinetics. PLoS One. 2015 Nov 12;10(11):e0142712. doi: 10.1371/journal.pone.0142712.
[2] Runkle, Erik. (2007) Maximizing Supplemental Lighting, GPN Magazine. Michigan State University Extension: https://www.canr.msu.edu/uploads/resources/pdfs/maximizingsupplementallighting.pdf
[3] Peet, Mary M. (1999). GREENHOUSE CROP STRESS MANAGEMENT. Acta Hortic. 481, 643-654 https://doi.org/10.17660/ActaHortic.1999.481.77
[4] Atkins, Ian & Boldt, Jennifer. (2022). Photosynthetic Responses of Greenhouse Ornamentals to Interaction of Irradiance, Carbon Dioxide Concentration, and Temperature. Journal of the American Society for Horticultural Science. 147. 82-94. 10.21273/JASHS05115-21. https://journals.ashs.org/jashs/view/journals/jashs/147/2/article-p82.xml